


A poker variance calculator answers one question: if you really are a winner, how far can your results drift from what you "should" have won? The free EdgeTilt calculator answers it in four numbers, right in your browser, no login.
Open the EdgeTilt Poker Variance Calculator in cash mode and follow along. This guide goes through each input, each result and the math behind them, with examples you can check yourself.
What you get from it
Before the details, here's what the calculator tells you:
- How much you should win over a stretch of hands
- How far your real result can drift from that, in big blinds
- A low and high end for where you'll probably finish
- The odds a winning player is still down at the end
Quick start
- Pick a Confidence level (95% is a good default).
- Enter your Win rate and Standard deviation, both in bb/100.
- Enter the number of Hands you want to look at.
- Read the four results, starting with the low end of the Confidence range.
That's the whole tool. The rest of this guide explains what each number means and how to trust it.
The math in plain words
The calculator treats every 100 hands as one step. On average you win your win rate each step, but the real result bounces around by your standard deviation. Add up enough of those steps and your total lands on a bell curve.
Two things grow as you play more hands, at different speeds:
- Your expected win grows in a straight line. Twice the hands, twice the expected profit.
- Your swing grows with the square root of hands. Four times the hands only doubles the swing.
That gap is what variance is. Over a short sample, the swing is bigger than your edge and anything can happen. Over a long one, your edge pulls ahead and your results start to look like your skill.
The formulas the page uses:
- Expected = win rate × hands ÷ 100
- 1 SD swing = standard deviation × √(hands ÷ 100)
- Confidence range = expected ± z × swing, where z is 2 at 95%, 1.645 at 90% and 2.576 at 99%
- Chance of being down = the share of the bell curve that sits below zero
The inputs
Confidence
A dropdown with 90%, 95% and 99%. It sets how wide the Confidence range is. At 95% the page uses exactly two standard deviations, which matches the simple "two standard errors" rule we use across EdgeTilt. That's a hair wider than the textbook 1.96, so the range leans a little safe. This setting only changes the range. The other three results stay the same.
Win rate (bb/100)
Your average profit in big blinds per 100 hands. Your tracking software shows yours. If you don't have it, use a guess and see how the answer moves. A negative win rate works too.
Standard deviation (bb/100)
How much your results swing per 100 hands. Typical values for no-limit hold'em are roughly 70 to 100 bb/100, and loose or aggressive games run higher. It has to be above zero. Your tracker shows it next to your win rate.
Hands
The number of hands you want to look at. Type the real hand count (100000, not 1000 "units of 100"). Think of it as: "where could I be after this many hands?"
The results
Expected (bb)
What you'd win on average if you played this stretch over and over. It's win rate times hands divided by 100.
1 SD swing (bb)
The typical distance between your real result and the expected one. About two out of three stretches end within one swing of expected.
Confidence range
The low and high end of where your result should land at the confidence you picked. At 95%, about 19 of 20 stretches finish inside this range. Watch the low end. If it's below zero, a losing stretch this long is normal, even for a winner.
Chance of being down
The odds you finish this stretch below zero even though your win rate is positive. It doesn't change with the Confidence setting.
Worked example: the page's defaults
The page opens with Win rate 5, Standard deviation 90, Hands 100000 and Confidence 95%.
- Expected (bb): 5 × 100,000 ÷ 100 = +5,000
- 1 SD swing (bb): 90 × √1,000 ≈ +2,846
- Confidence range: 5,000 ± 2 × 2,846 = -692 to +10,692
- Chance of being down: 4%
So a real 5 bb/100 winner has about a 1 in 25 chance of being down after 100,000 hands. That's a lot of poker to still be losing, and it happens.
Switch Confidence to 90% and the range tightens to +319 to +9,681. At 99% it widens to -2,331 to +12,331. The other three numbers stay put.
Worked example: a short sample
Now drop Hands to 10000 and keep the rest.
- Expected (bb): +500
- 1 SD swing (bb): +900
- Confidence range: -1,300 to +2,300
- Chance of being down: 29%
The swing is almost twice your expected win. Over 10,000 hands, a solid winner is down more than a quarter of the time. That's why a month of results tells you very little about how good you are.
Worked example: two different players
| Player | Win rate | SD | Hands | Expected | Confidence range (95%) | Chance of being down |
|---|---|---|---|---|---|---|
| Small edge, big sample | 2 | 80 | 50,000 | +1,000 | -2,578 to +4,578 | 29% |
| Big edge, small sample | 8 | 100 | 20,000 | +1,600 | -1,228 to +4,428 | 13% |
A small edge takes a lot of hands to show up. A big edge shows sooner, but even an 8 bb/100 player is down after 20,000 hands about one time in eight.
Where to get good inputs
The answer is only as good as what you type in.
- Win rate: your tracked number over the biggest sample you have. If your sample is small, shade it down. Optimism here makes every result look safer than it is.
- Standard deviation: this one settles fast, so even a modest sample from your tracker is useful. Looser games, deeper stacks and a more aggressive style all push it up. If you have nothing, start at 90 and test 80 and 100.
- Hands: pick a stretch that means something to you, like a month, a quarter or a year of your usual volume.
Common mistakes
- Entering hands in hundreds. Type 100000, not 1000.
- Mixing units. Win rate and standard deviation both need to be per 100 hands. A per-hour live number has to be converted first (or use Live mode in the app).
- Treating the range as a guarantee. At 95%, one stretch in twenty still lands outside it.
- Using a hot-streak win rate. A great month is not your true win rate. See the win rate confidence tool in the app below.
How to use it well
- Use your own numbers. Pull win rate and standard deviation from your tracker once you have a few thousand hands.
- Look at the low end of the range. Make sure your bankroll and your head can handle that number, in big blinds.
- Check a downswing against it. If you're down 1,000 bb over 20,000 hands, run your numbers. If it's inside the range, it's probably variance, not a leak.
- Track your sessions. The EdgeTilt poker bankroll tracker keeps your results in one place so the inputs here stay current.
Limits of this calculator
This page is a quick normal curve estimate. It shows the range of your total at the end of the stretch, not the path you take to get there. It doesn't show how deep a downswing can go along the way, and it doesn't compute risk of ruin. It also assumes your win rate and standard deviation are known and stay the same, and in real games they never quite do.
FAQ
What's a good standard deviation to use? If you don't have tracker data, 90 bb/100 is a fair starting point for no-limit hold'em. Try 80 and 100 to see how much it matters.
Why does the 95% range use 2 instead of 1.96? It keeps the math simple and matches the rule of thumb used across EdgeTilt. The range comes out a touch wider, which errs on the safe side.
Does the calculator send my numbers anywhere? No. It runs in your browser and nothing is sent to EdgeTilt.
Can I use it for live poker? Yes, as long as your win rate and standard deviation are both in bb/100. Live players often track per hour, so convert first.
Go deeper in the app
The free page gives you the end point of a stretch. The full variance calculator in the EdgeTilt app, under Poker > Variance, shows the whole ride: the path, the downswings and the bankroll you need. It's free with an account. Below, each panel is explained in the order you'll see it, using one example run: Online, 5 bb/100, SD 90, 50,000 hands.
Online or live, hours instead of hands
Pick Online and you work in bb/100 over a number of hands, like the free page. Pick Live and you enter your win rate in dollars per hour, your SD per hour and a number of Hours. Live players think in hours, and converting to bb/100 by hand is where mistakes happen. This keeps your numbers in the units you actually track.
Results in bb or dollars
Online, Show results in switches between bb and $. Pick dollars, enter your Big blind, and every result, chart and table converts. A 3,000 bb downswing feels abstract. Call it $3,000 at $1 big blinds and you know exactly what your bankroll has to absorb.
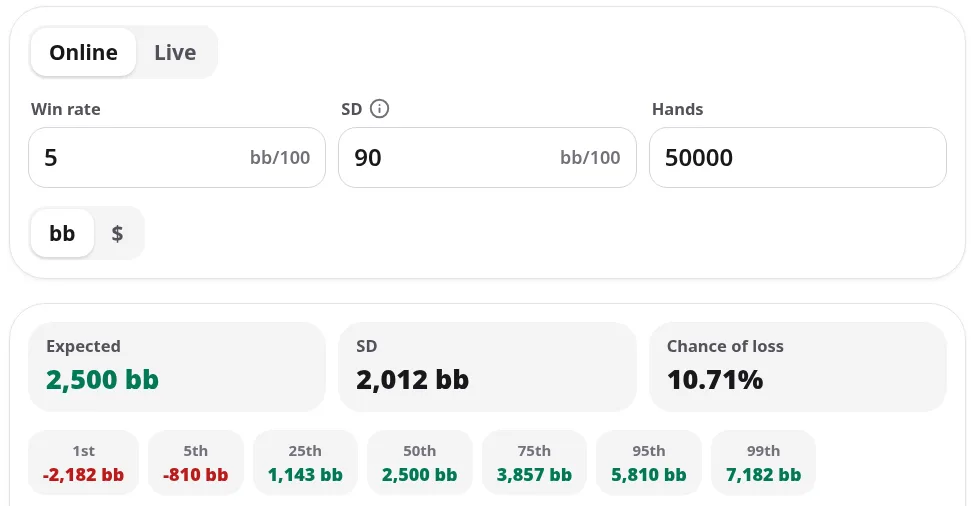
Inputs on the left, headline results on top. This is the example run used throughout this section.
Expected, SD, chance of loss and the bell curve
The top panel shows Expected, SD and Chance of loss, plus a row of percentiles (1st, 5th, 25th, 50th, 75th, 95th and 99th) and a bell curve chart. The percentiles read like this: the 5th percentile is the result only 5% of stretches finish below.
In the example run, expected is 2,500 bb with an SD of 2,012 bb, and the chance of loss is 10.71%. So a solid 5 bb/100 winner finishes 50,000 hands in the red a bit more than one time in ten. The 1st percentile is -2,182 bb and the 99th is 7,182 bb. That's the realistic spread from "worst week of your life" to "heater."
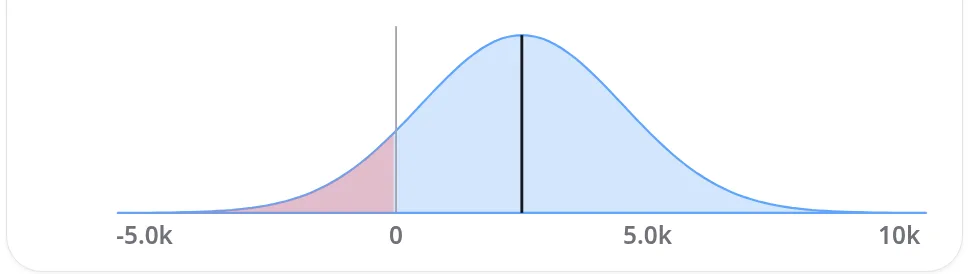
The bell curve. The shaded share left of zero is your chance of loss.
Sample paths, with Re-roll
This chart draws 20 simulated runs over your sample, with your expected line and dashed lines that hold 95% of results. Each line is a realistic version of your next stretch. Tap Re-roll to draw a fresh 20. Watching a winning player's line spend thousands of hands underwater is the fastest way to stop panicking over a bad month.
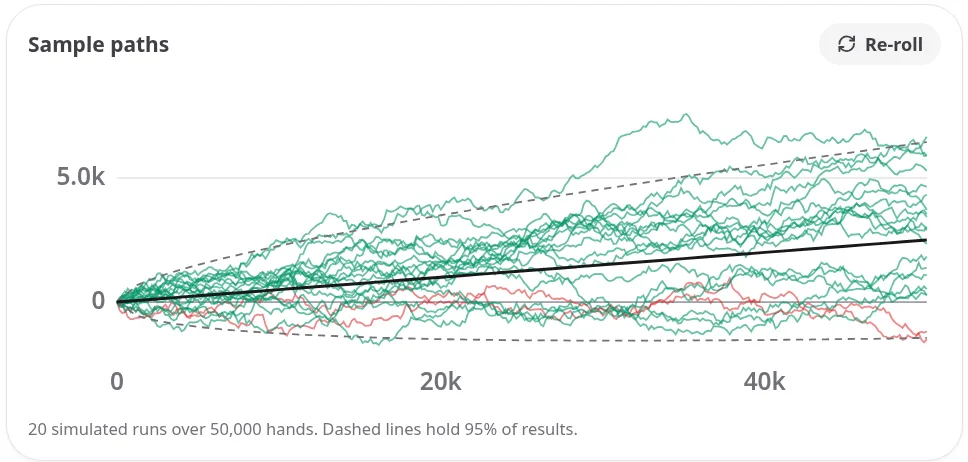
Twenty possible versions of the same 50,000 hands. Same player, same edge.
Downswings
Across 2,000 simulated samples, the app records the biggest peak-to-valley drop (Size) and the longest stretch below a previous high (Length), then shows them by percentile. The 5th percentile row is the bad tail: only 5% of samples see a bigger or longer one. Plan around this number. Your end result can look fine while the road there hurts.
In the example, the 5th percentile downswing is -2,958 bb, lasting 43,329 hands. Read that slowly: one sample in twenty, a winning player spends most of the 50,000 hands below a previous high. The free page can't show you this, and it's the number that decides whether you keep your head.
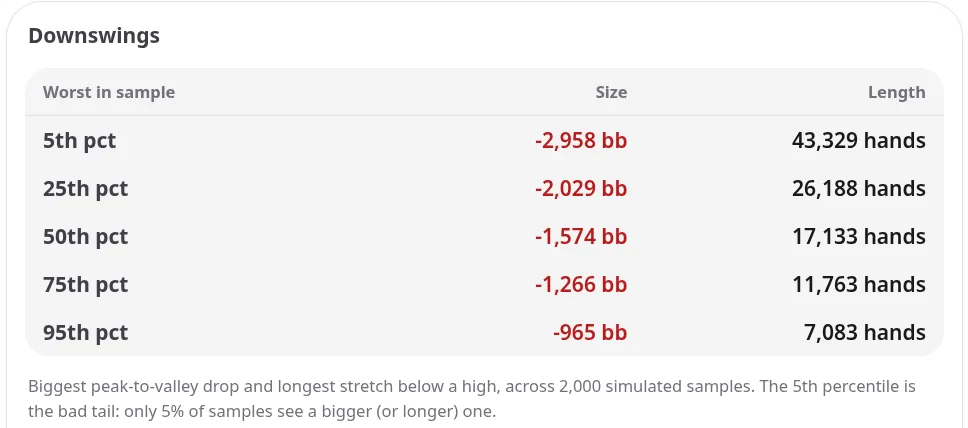
Downswing size and length by percentile, from 2,000 simulated samples.
Bankroll for risk of ruin: Forever vs over your sample
This table gives the starting bankroll you need to keep your chance of going broke at 50%, 20%, 5% or 1%. The Forever column assumes you keep playing with no end date. The Over column (for example, "Over 50,000 hands") covers only the stretch you entered, so it's smaller. Use Forever for a long-term bankroll and the shorter column for a shot at a higher game.
For the example run, a 1% risk of ruin takes 3,730 bb forever, or 2,995 bb over the 50,000 hands. At 100 bb per buy-in, that's about 37 and 30 buy-ins.
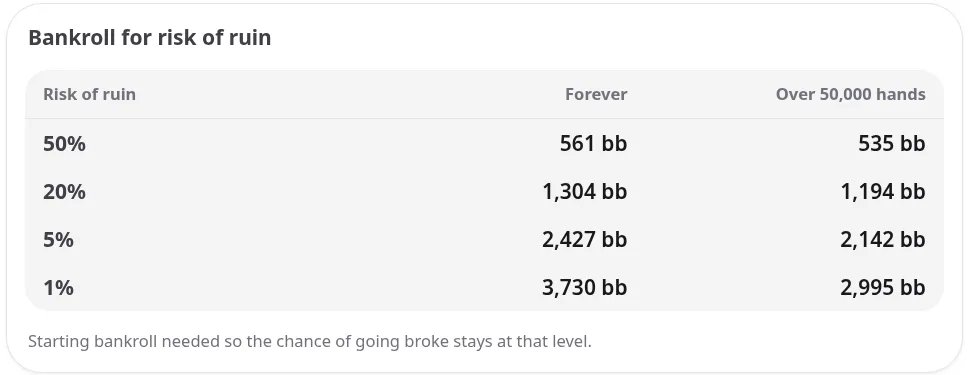
Bankroll needed at each risk of ruin level. Forever on the left, this sample only on the right.
Win rate confidence
Choose 80%, 90%, 95% or 99% and the app shows your Standard error and a True win rate range. It flips the question around: given the win rate you ran over this many hands, where could your real win rate be? If that range still includes zero, your sample can't yet prove you're a winner.
In the example, the standard error is 4.02 bb/100, and the 95% true win rate range runs from -2.9 to 12.9 bb/100. Even after 50,000 hands at 5 bb/100, you can't yet rule out being a losing player. That's humbling, and it's exactly why tracking more volume matters.
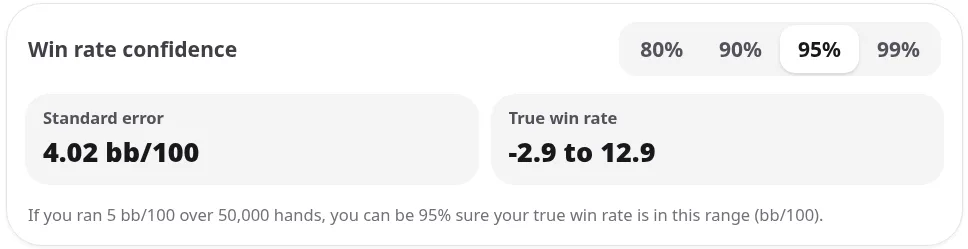
Your true win rate range. If it crosses zero, the sample hasn't proven your edge yet.
Quick start in the app
- Sign in and open Poker > Variance, cash game tab.
- Choose Online or Live, then bb or $.
- Enter win rate, SD and hands (or hours).
- Read the headline numbers, then scroll: paths, downswings, bankroll, win rate confidence.
Try it free
Sign up at edgetilt.com to use the full variance calculator under Poker > Variance, alongside the poker bankroll tracker that keeps your win rate and sample size current. Until then, the free cash game variance calculator is a click away.